


It’s time to move beyond means and medians
For decades, ED leadership teams have relied on coarsely reported metrics to track operational performance. Focusing only on means and medians leads to missed opportunities to provide better quality of care. Our ED Insights platform moves our collaborators beyond means and medians and leads them to actionable insights hidden in their data. Here is why this is so important.
I’m sure you all know your monthly median Door to Provider times. But what is this really telling us? Your monthly median Door to Provider time was 20 minutes that means half the patients saw a provider in less than 20 minutes and half saw the provider in more than 20 minutes. That’s it. That’s all we know. If your ED sees 6000 patients per month, 3000 patients saw a provider more than 20 minutes after arrival. Do we know how much more? Do we know how many patients had a door-to-provider time of more than 60 minutes? Do we know how door to provider time varies by time of day or day of week? What about for walk-in ESI 3 patients?
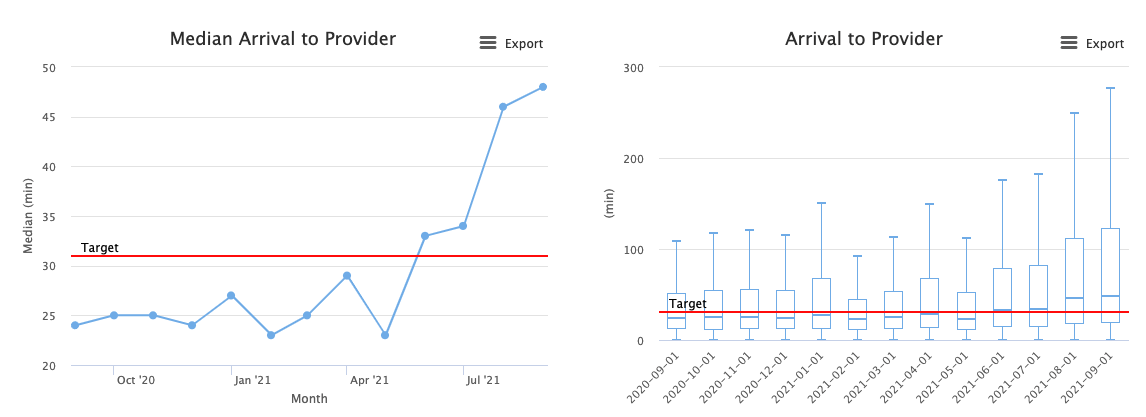
Consistently tracking and trending medians does not give us visibility into variability. As an example, look at the following trends in median door to provider time on a monthly basis. The median starts to increase slightly in June and July then takes off.
Compare this to trends of the distribution as represented by a boxplot. Although the median can stay flat or only slightly increase, the 75th percentile can increase faster and sooner. If we only look at medians we miss this. Even worse, we might convince ourselves that we’re remaining consistent in our performance. Even something as simple as a boxplot can change your understanding of your EDs performance. In this case, if this ED had ED Insights available in June, they could’ve identified that the variability was beginning to increase faster than the median. Early identification could have prevented the explosion in not just the median but the variability in door to provider time since August.
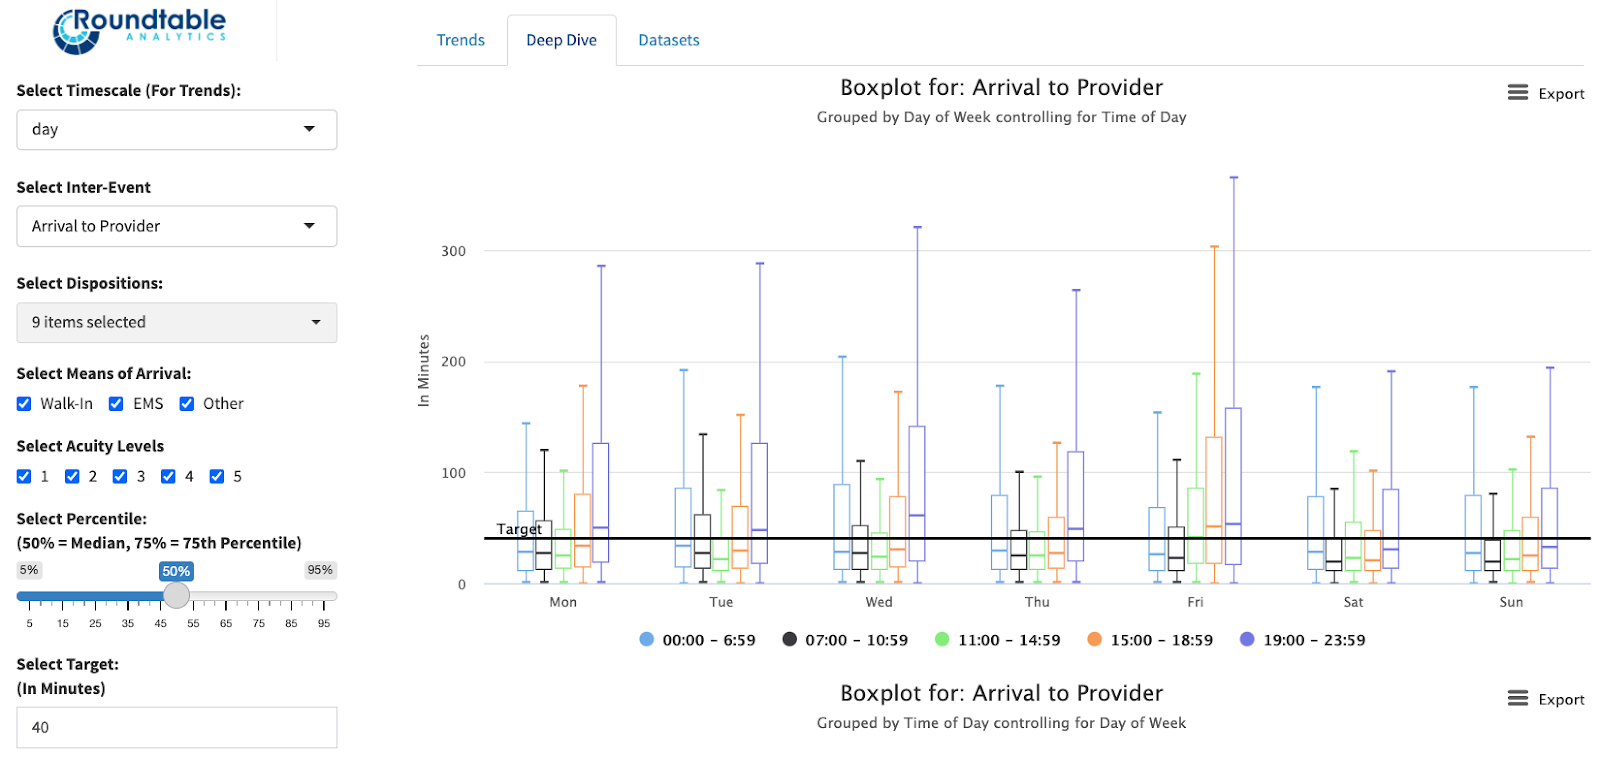
Most importantly, through ED Insights once you see monthly variability increasing, you can quickly drill down to discover how Door to Provider time varies controlling for time of day and day of week – and how it’s most extreme for certain subpopulations. Is there a consistently problematic time that is driving the changes we’re seeing at a monthly timescale?
The ability to quickly explore variability creates the actionable insights you need to make better decisions.

Understanding variability helps you understand the experience of a substantial portion of your patients. The 90th percentile of arrival to provider isn’t just a number, it tells you what 10% of your patients experience. That 10% is somebody’s mother, father, or child. For those 10% of patients, it might be their first experience with your healthcare system. Everyone should know what the upper 10% of their patients experience and be able to target PI efforts to reduce it when necessary.
In the same way that not understanding variability in interevent metrics limits our ability to target process improvement, not understanding variability in LWBS rates causes a similar problem.
Do you know how many people left without being seen last month? Of course you do. Do you know how many left on Mondays that arrived between 1900 and 2359? Oftentimes a majority of an EDs total LWBS occurs during only a few hours out of the week. ED Insights reveals this information and helps you target additional resources.

Coarse metrics that EDs have historically depended on are not enough. The metrics that CMS reports are not enough. They do not tell us where the opportunities to improve are hidden. As an industry, we can’t be complacent with old ways of measuring performance. We owe it to our patients and our clinical teams to identify where we are consistently underperforming and tactically deploy resources in problematic times.
Although moving beyond means and medians is a simple concept, EDs often lack the tools to routinely and clearly understand variability. From a cultural perspective, without the ability to easily monitor variability, it’s not going to influence operational decision making. While the hype around AI and machine learning is well warranted, there is tremendous benefit in making less sophisticated statistical analyses and novel visualizations of variability accessible to operational decision makers.
Our ED Insights platform was designed to provide ED leadership teams with the granularity needed to understand how their metrics vary and identify areas to target their process improvement efforts. Contact us to learn more about how you can begin your journey beyond means and medians using our ED Insights platform!